
In an era of instant information, financial decisions are increasingly determined by real-time news and public sentiments. Utilizing the power of natural language processing (NLP), we set out to build a sentiment-based decision-making bot that analyzes the tone of news headlines and descriptions to suggest as (e.g. POSITIVE, NEGATIVE or NEUTRAL). Using Hugging Face’s multilingual BERT model, the bot estimates the sentiment of news articles fetched from NewsAPI, assigns a confidence score, and logs its analysis for further insights. In this blog, we will show you how we combined transformers, data visualization, and automated decision logic to create a tool that demonstrates how generative AI can enable smarter financial strategies.
The system leverages the multilingual BERT model from Hugging Face to perform sentiment analysis on real-time news fetched through NewsAPI. News articles are first cleaned and preprocessed to ensure accurate analysis. The sentiment results are then translated into tones like NEGATIVE, NEUTRAL, or POSITIVE using simple rules. All outcomes are logged into a CSV file for tracking and future reference. Finally, the results are visualized using charts and tables to make insights easy to understand.
Pros | Cons |
End-to-End Sentiment Analysis Workflow | Weak Invalid Validation |
Actionable Insights | No Duplicate Check in Logging |
Data Logging | No Asynchronous Support |
Modular Functions | No Sentiment Analysis for all Headlines |
User Interaction | No Optimization for Large Datasets |
Visualization | No GUI Integration |
We need a few essential Python libraries to run our sentiment analysis system efficiently, which can be easily installed from pip. The project setup is shown below.
pip install transformers torch huggingface_hub tabulate requests matplotlib
from tabulate import tabulate
from transformers import AutoTokenizer, AutoModelForSequenceClassification, pipeline from huggingface_hub import login
import csv
from datetime import datetime
import requests
import matplotlib.pyplot as plt
The transformers library by Hugging Face simplifies working with pre-trained models like BERT for tasks such as sentiment analysis. torch serves as the backend engine to run these models and huggingface_hub allows secure access to models using authentication tokens. We use tabulate to neatly display sentiment data in a table format, while requests fetch real-time news from NewsAPI. Lastly, matplotlib is used to visualize sentiment trends and action distributions through graphs and charts.
For loading the open-source model from Hugging Face, the login details should look like this.
login(token="token_number") #put token number in the quotes
# Model name
model_name = "nlptown/bert-base-multilingual-uncased-sentiment"
print("Loading model...")
# Load tokenizer and model
tokenizer = AutoTokenizer.from_pretrained(model_name)
model = AutoModelForSequenceClassification.from_pretrained(model_name)
# Create sentiment analysis pipeline
classifier = pipeline("sentiment-analysis", model=model, tokenizer=tokenizer)
# NewsAPI key
NEWS_API_KEY = "your _news_API_key"
This section sets up the sentiment analysis tool by logging into Hugging Face using an access token to access their hosted models. We use the multilingual model nlptown/bert-base-multilingual-uncased-sentiment · Hugging Face, which rates text sentiment on a scale of 1 to 5 stars. The tokenizer prepares the input text for the model, and both are combined into a pipeline. This pipeline allows us to quickly analyze any text and receive instant sentiment feedback.
If we want to do the sentiment analysis on the latest news, we can fetch the latest news articles by using NewsAPI. Firstly, we must use NewsAPI key to access NewsAPI. The code is shown below.
def fetch_news_headlines(query="technology", language="en", page_size=5):
url = f"https://newsapi.org/v2/everything?q={query}&language={language}&pageSize={page_size}&sortBy=publishedAt&apiKey={NEWS_API_KEY}"
response = requests.get(url)
If response.status_code != 200:
print(f"Error fetching news: {response.status_code} - {response.text}")
return []
news_data = response.json()
articles = news_data.get("articles", [])
headlines = []
for article in articles:
title = article.get("title", "No Title")
description = article.get("description", "No Description")
url = article.get("url", "")
published_at = article.get("publishedAt", "")
headlines.append({
"title": title,
"description": description,
"url": url,
"published_at": published_at
})
return headlines
This function fetches the latest news articles from NewsAPI based on a given keyword or topic. It allows customization through parameters like search query, language, and number of results. Each returned article includes the title, description, URL, and publication date. The function also checks for a successful API response and handles errors gracefully by displaying appropriate messages in case of issues like an invalid API key or network problems.
This function uses a Hugging Face sentiment analysis model called nlptown/bert- base-multilingual-uncased-sentiment · Hugging Face to figure out the tone of a news headline or paragraph. It gives ratings from "1 star" to "5 stars," and then it grabs that first number and a confidence score. We will get to see the result right on our screen, and it comes back as a tuple, too. This is how we evaluate sentiment!
def get_news_sentiment(text):
result = classifier(text)
if result and isinstance(result, list):
label = result[0]['label'] # e.g., "4 stars"
score = result[0]['score']
print(f"Model Output: {label}, Score: {score:.2f}")
return int(label[0]), score # Return both star and score
else:
raise ValueError("Unexpected result format")
Based on the star rating, we make decisions such as SELL, BUY, or HOLD
def tone(star_rating):
if star_rating <= 2:
return "Negative"
elif star_rating == 3:
return "Neutral"
else:
return “Positive”
This simple logic function translates star ratings into stock-style tones: Positive, Negative, or Neutral. If the rating is below 2, it suggests negative, indicating negative sentiment. A rating of 3 leads to a neutral, implying a neutral or balanced sentiment. Ratings above 3 trigger a positive, reflecting positive outlooks. This direct mapping of sentiment to action helps in trading strategies, trend analysis, and monitoring public perception in real-time.
After making decisions, we must store them in csv file for future reference.
def log_sentiment(news, sentiment, action):
with open("sentiment_log.csv", mode='a', newline='', encoding='utf-8') as file: writer = csv.writer(file, quoting=csv.QUOTE_ALL) writer.writerow([datetime.now(), news, sentiment, action]) print("Sentiment successfully logged.")
This function adds sentiment results to a CSV file named sentiment_log.csv. Each row captures the time when the data was stored, the news text, the predicted star rating, and a suggested action. Keeping a log like this makes it easy to look back for historical analysis, plot trends, and visualize data later. It uses UTF-8 encoding to play nice with various systems and makes sure each entry is properly separated using Python's csv module.
Sometimes the user needs to see the historical data manually to make further decisions, so we use tables for this purpose.
def read_log_table(n):
try:
with open("sentiment_log.csv", mode='r', encoding='utf-8') as file:
reader = csv.reader(file)
lines = list(reader)
if not lines:
print(" Log file is empty.")
return
# last n entries
recent_lines = lines[-n:]
data = recent_lines
headers = ["Timestamp", "News", "Stars", "Action"]
print("\n Last Logged Entries:")
print(tabulate(data, headers=headers, tablefmt="fancy_grid"))
except FileNotFoundError:
print(" Log file not found.")
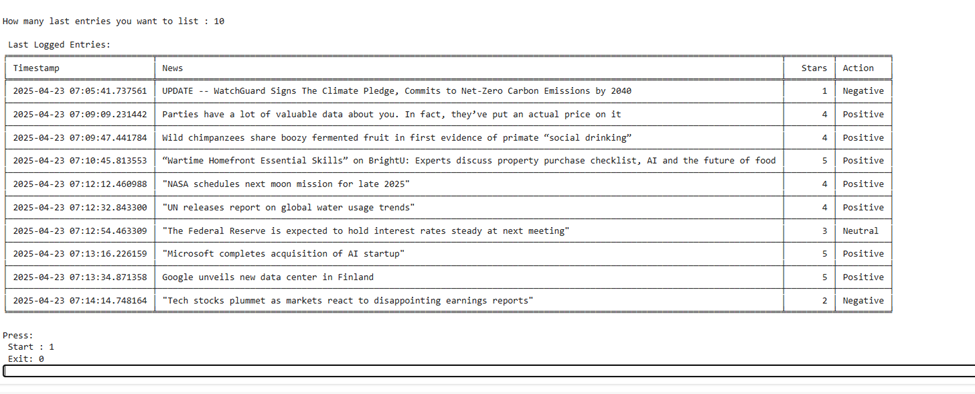
Reads and displays the last n lines of the sentiment_log.csv file in a clean, readable table format using the tabulate library. The function ensures users can view recent history in a structured and visually friendly way. It handles missing files and empty logs gracefully with error messages.
This function plots a time series line chart of sentiment ratings over time using matplotlib.
def plot_sentiment_trend(csv_file="sentiment_log.csv"): timestamps = []
star_ratings = [] try:
with open(csv_file, mode='r', encoding='utf-8') as f: reader = csv.reader(f)
for row in reader:
if len(row) < 3:
continue try:
timestamps.append(datetime.fromisoformat(row[0])) star_ratings.append(int(row[2]))
except Exception as e:
print(f"Skipping row: {row} -> {e}") except FileNotFoundError:
print("Sentiment log file not found.") return
If not timestamps:
print("No data to plot.") return
plt.figure(figsize=(10, 5))
plt.plot(timestamps, star_ratings, marker='o', linestyle='-', color='skyblue') plt.title("Sentiment Trend Over Time")
plt.xlabel("Time") plt.ylabel("Star Rating (1–5)") plt.grid(True) plt.tight_layout()
plt.show()
It parses timestamps and star ratings from the CSV and visualizes how sentiment has evolved. It's helpful for detecting mood shifts, media tone changes, or general trends in news sentiment over time. It includes error handling for missing files or bad data rows.
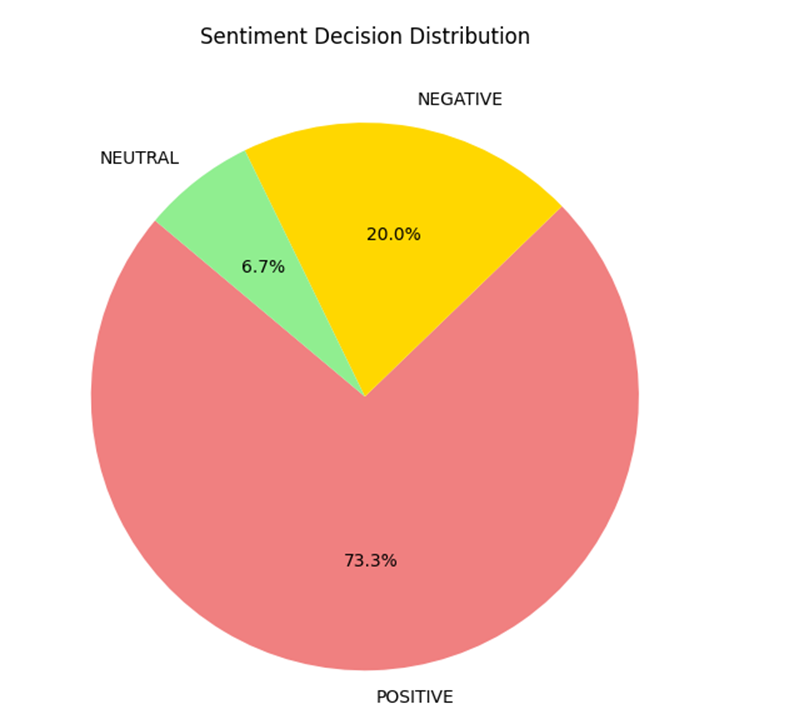
This function displays either a pie chart or a bar chart of the frequency of sentiment actions (BUY, SELL, HOLD) using historical log data. It uses collections. Counter to count actions and matplotlib for plotting. You can choose between pie and bar visualization styles, depending on your preference or data story. It provides a macro-level view of decision distribution.
def plot_action_distribution(csv_file="sentiment_log.csv", chart_type="pie"):
actions = []
try:
with open(csv_file, mode='r', encoding='utf-8') as f:
reader = csv.reader(f)
for row in reader:
if len(row) >= 4:
actions.append(row[3].strip().upper())
except FileNotFoundError:
print("Sentiment log file not found.")
return
If no actions:
print("No actions found to visualize.")
return
action_counts = Counter(actions)
labels = list(action_counts.keys())
values = list(action_counts.values())
plt.figure(figsize=(6, 6))
if chart_type == "pie":
plt.pie(values, labels=labels, autopct='%1.1f%%', startangle=140, colors=['lightcoral', 'gold', 'lightgreen'])
plt.title("Sentiment Decision Distribution")
elif chart_type == "bar":
plt.bar(labels, values, color=['lightcoral', 'gold', 'lightgreen'])
plt.title("Sentiment Decision Count")
plt.ylabel("Count")
else:
print("Invalid chart_type. Use 'pie' or 'bar'.")
return
plt.tight_layout()
plt.show()
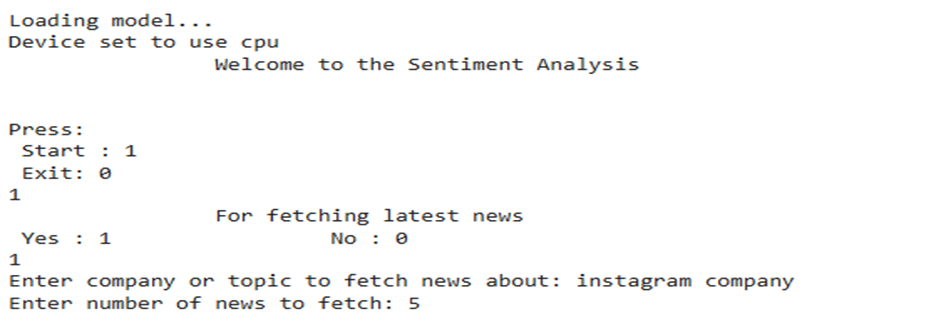
The main loop acts like the interactive brain of the whole program; it guides us through everything step by step. When you run the script, it welcomes us and gives us the option to start or exit. If we choose to start, it asks if we would like to fetch the latest news about a specific topic (like a company or keyword). Once we enter a topic and the number of articles to fetch, it pulls in recent headlines using the News API and displays them neatly.
Then, we can input any news text we want to analyze. The model gives it a sentiment score (from 1 to 5 stars), shows how confident it is with a visual bar, and based on that, it decides whether we should BUY, HOLD, or SELL based on the tones POSITIVE, NEGATIVE, or NEUTRAL, respectively. The result gets logged into a CSV file, and we are shown trend graphs and action distribution pie charts to visualize past data. Finally, it gives us an option to look back at recent entries and a summary of what's been logged. This keeps looping until you say we are done, simple, interactive, and insightful. The main loop is shown below.
if _name_ == "_main_":
print("\t\tWelcome to the Sentiment Analysis\n")
while True:
n= int(input("\nPress:\n Start : 1\n Exit: 0\n"))
# Run the bot
if n==1:
input_news = int(input("\t\tFor fetching latest news \n Yes : 1\t\t No : 0\n"))
if input_news == 0:
print("\n")
elif input_news == 1:
company = input("Enter company or topic to fetch news about: ")
in1 = int(input("Enter number of news to fetch: "))
headlines = fetch_news_headlines(query=company, page_size=in1)
If not headlines:
print("No news found.")
else:
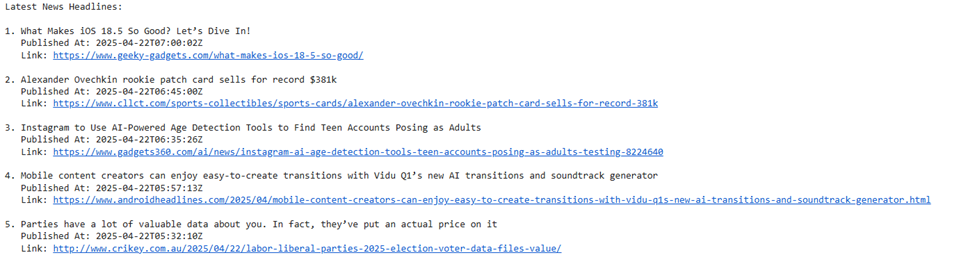
print("\nLatest News Headlines:\n")
for idx, news in enumerate(headlines, 1):
print(f"{idx}. {news['title']}")
print(f" Published At: {news['published_at']}")
print(f" Link: {news['url']}\n")
else:
print("Invalid Input")
sample_news = input("Enter a sample news: ")
print("\n")
sentiment = get_news_sentiment(sample_news)
star_rating, score = get_news_sentiment(sample_news)
tone_of_news = tone(star_rating)
log_sentiment(sample_news, star_rating, tone_of_news)
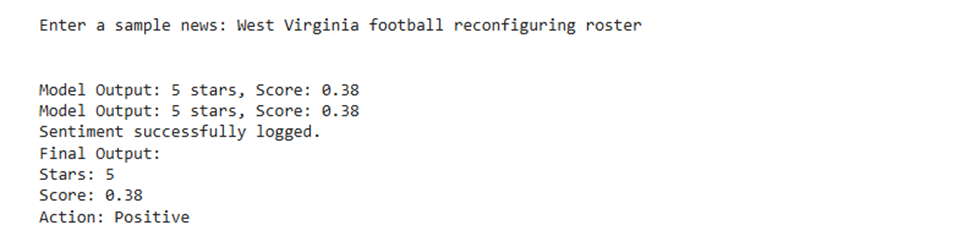
print(f"Final Output:\nStars: {star_rating}\nScore: {score:.2f}\nAction: {tone_of_news}")
plot_sentiment_trend()
plot_action_distribution(chart_type="pie")
n1=int(input("How many last entries you want to list : "))
if n1==0:
continue;
else:
read_log_table(n1)
elif n==0:
print("Exiting...\n \t\t GoodBye")
break
else:
print("Invalid Input")
In this example, the user enters 1 to start the program then again enter 1 to fetch the latest news articles. After that the program also asks the company or topic for fetching news. Here, the user enters the topic or company “instagram company” and then the user has to enter number of headlines you want to fetch and here the user fetched 5 headlines.
The user enters the prompt as shown in the figure below. After entering the prompt (news article), the article goes for the sentiment analysis and gives its score, star-rating and its tone.
Also, the program automatically draws a graph and a chart of the data stored in the log file, as you can see in the figures shown below.
Then the program asks to enter the number of entries to show in the table format, along with their corresponding data. And then again starts the program to enter if the user wants to continue.
This Python script serves as a complete mini-application that integrates real-time news fetching, sentiment analysis using a transformer model, decision-making logic, data logging, and data visualization, all from the command line.
nlptown/bert-base-multilingual-uncased-sentiment · Hugging Face
Powered by Froala Editor